Worked on both UX and UI for a survey reporting web application app.
Tools used:
- Adobe XD for wireframes, image creating and prototypes
- Axure for prototypes
- Lucid Chart for site maps and user flow charts
Project Information:
Working to redesign a web application for an Employee Engagement company.
The website will be used by their clients to create surveys, sent the surveys to their employees and then to view the results in different reports. The main user for this web app is HR professionals with the plan to eventually allow managers to see their own reports.
Their current web app had various issues both technological and with user experience.
My task is to work with the Project Manager and Development to redesign their website to match requirements and for it to be easy to use.
For the new application we decided to use a third party for the survey creation and sending. The rest of the application (reports, user and organization creation, settings, etc) still needed to be planned.
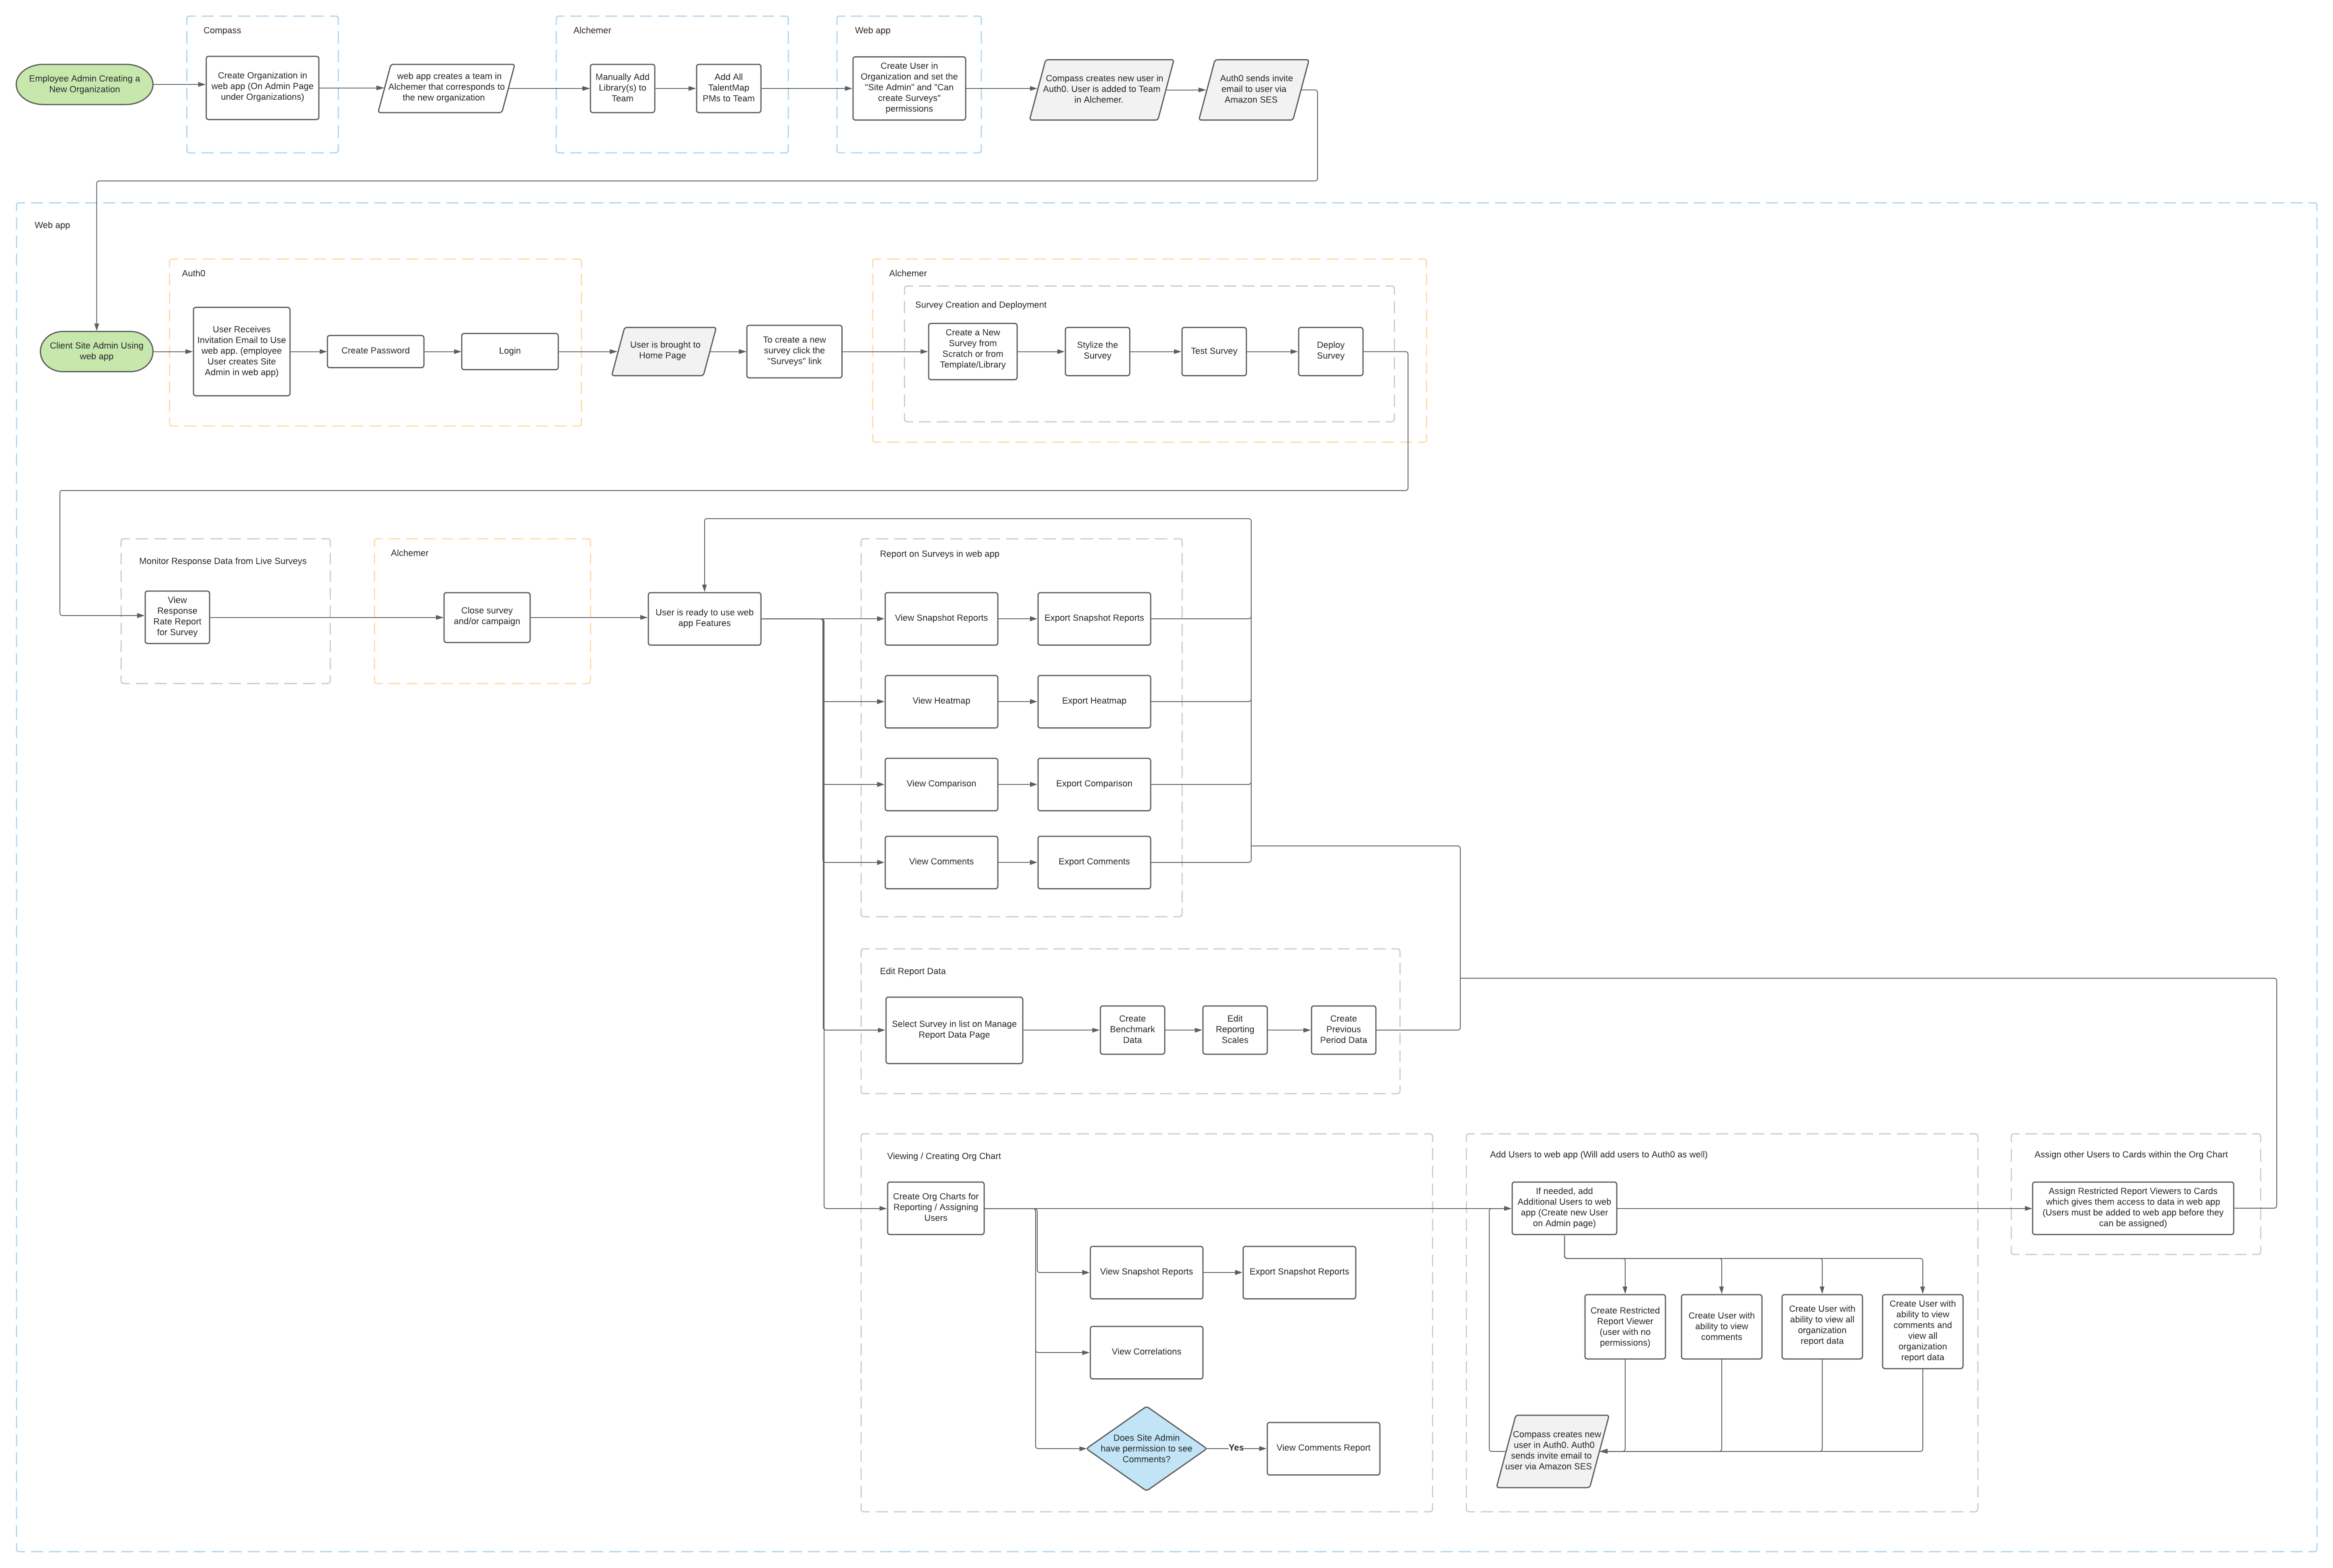
Various user flow documents were created. This was to try and get an idea of how the user will use the app and what steps that may be needed to get from creating and sending a survey, seeing responses, setting up and viewing reports, then finally adding managers to the site.
When a new feature was being creating, separate smaller user flows were created. This both helped with creating the design and with development when it came time to implement the feature.
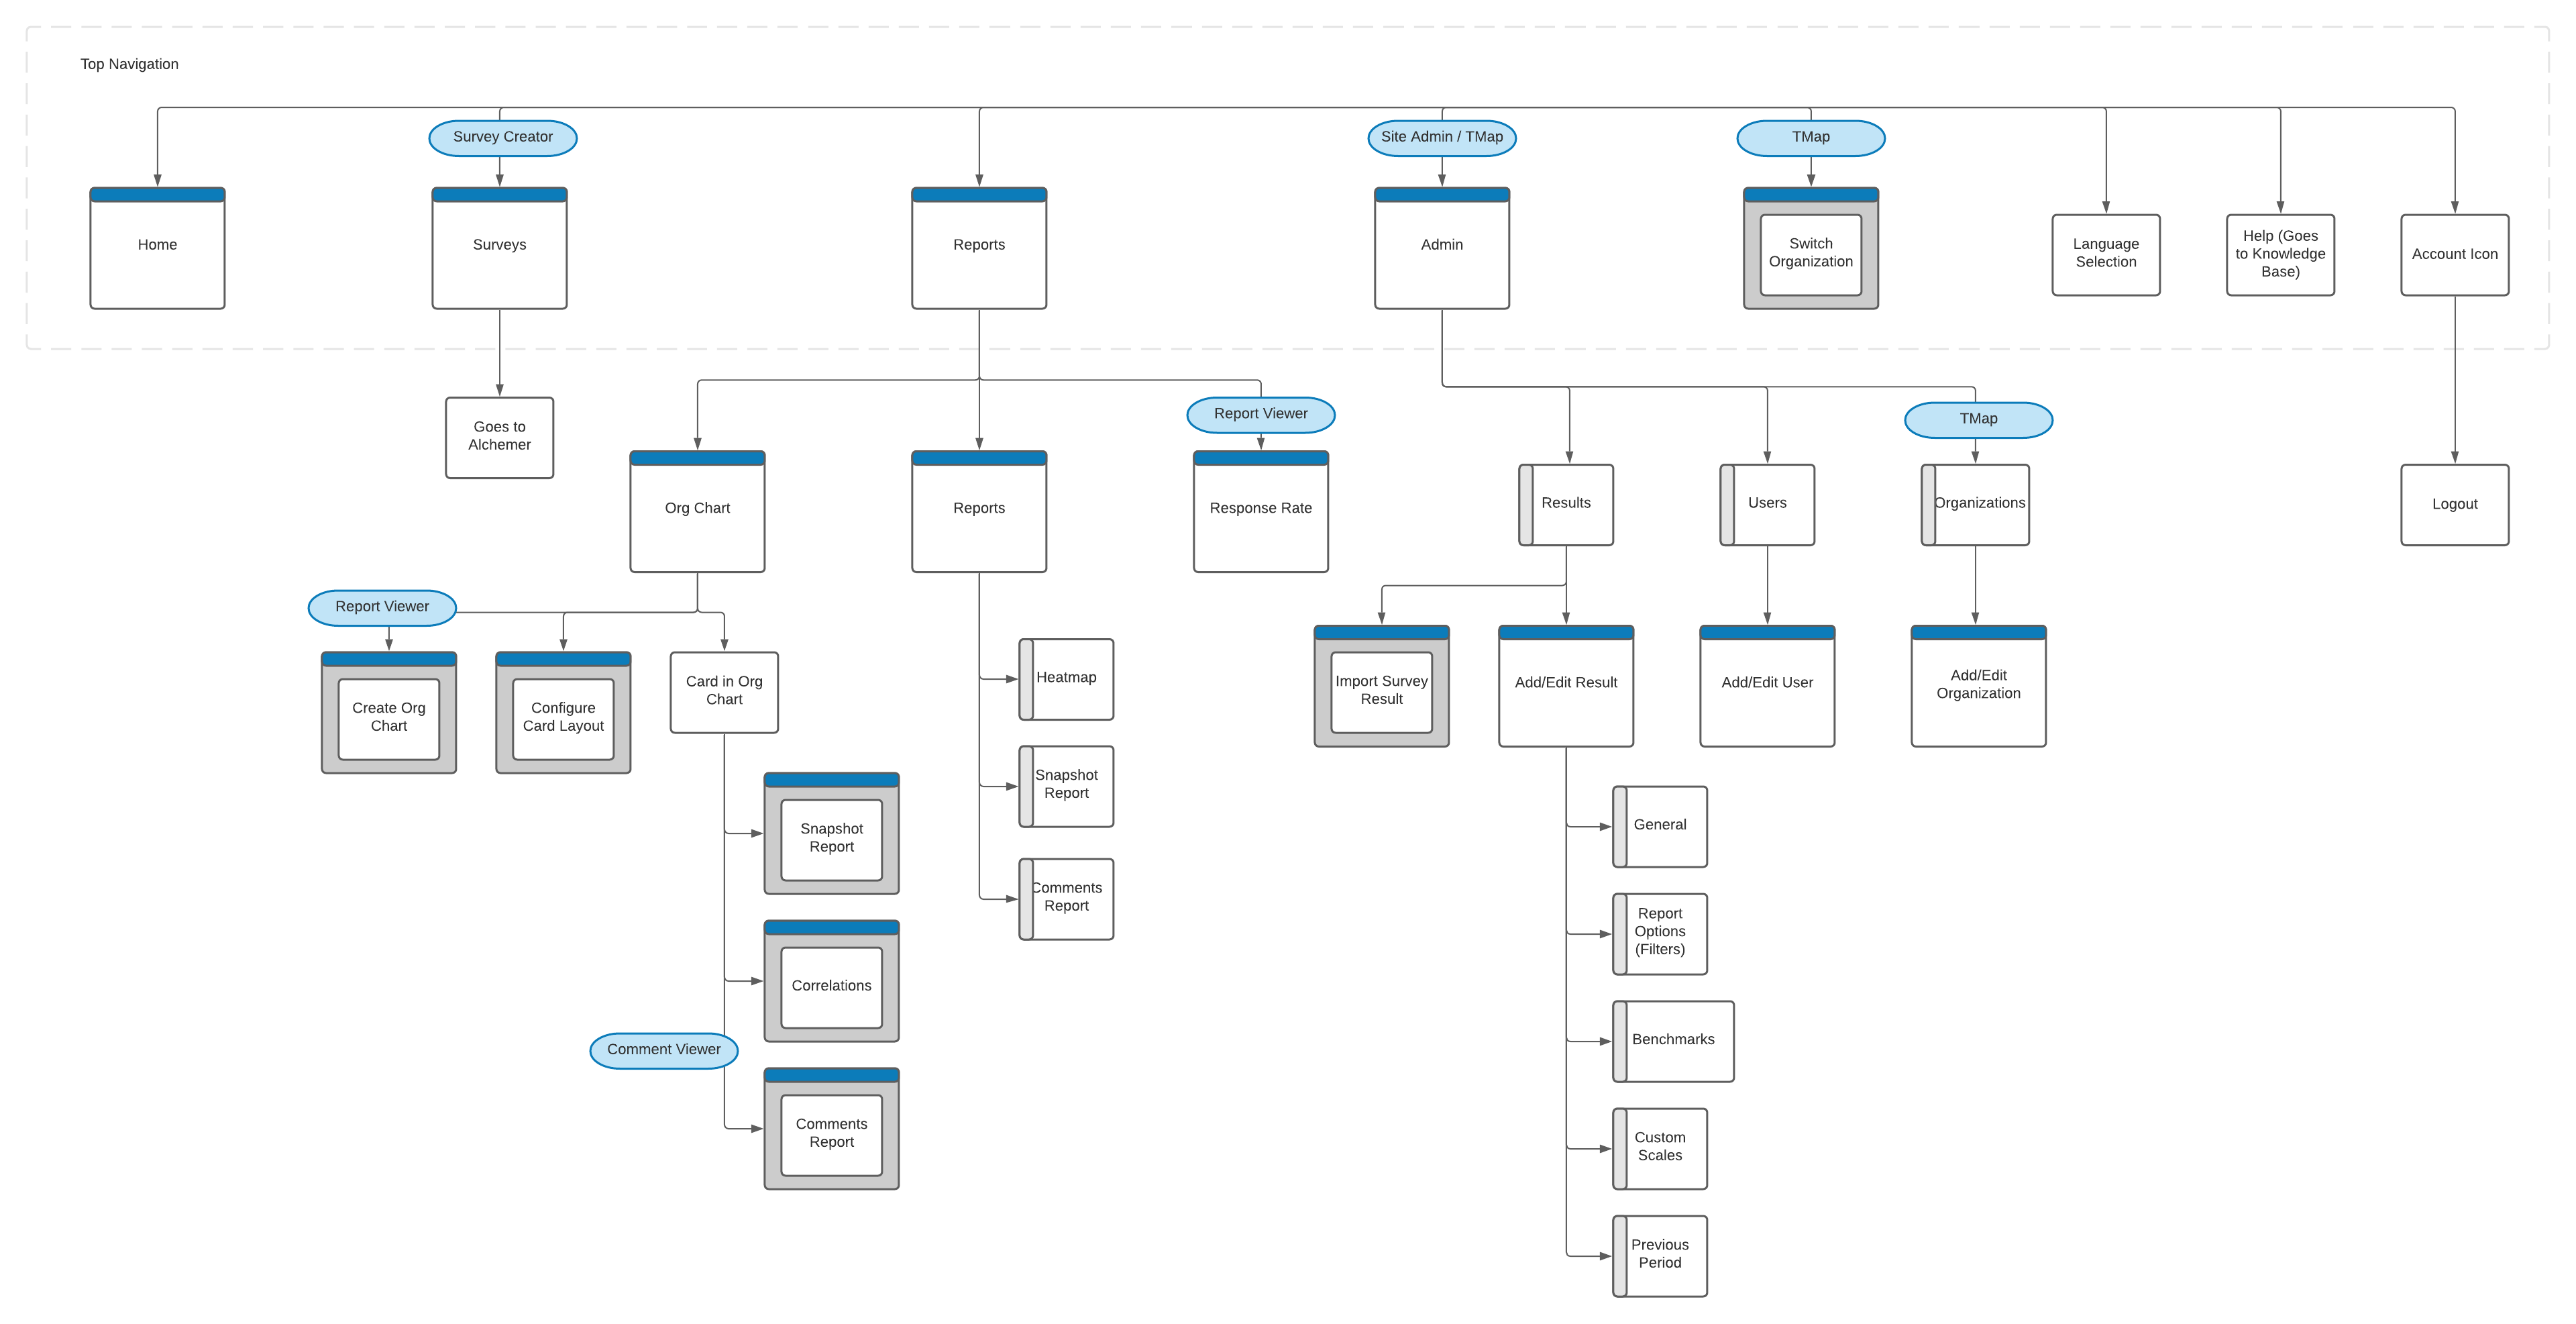
A site map was designed to both get an idea of how the site will be laid out and for reference. As new features came up, this was used to help decided where it will fit on the page.
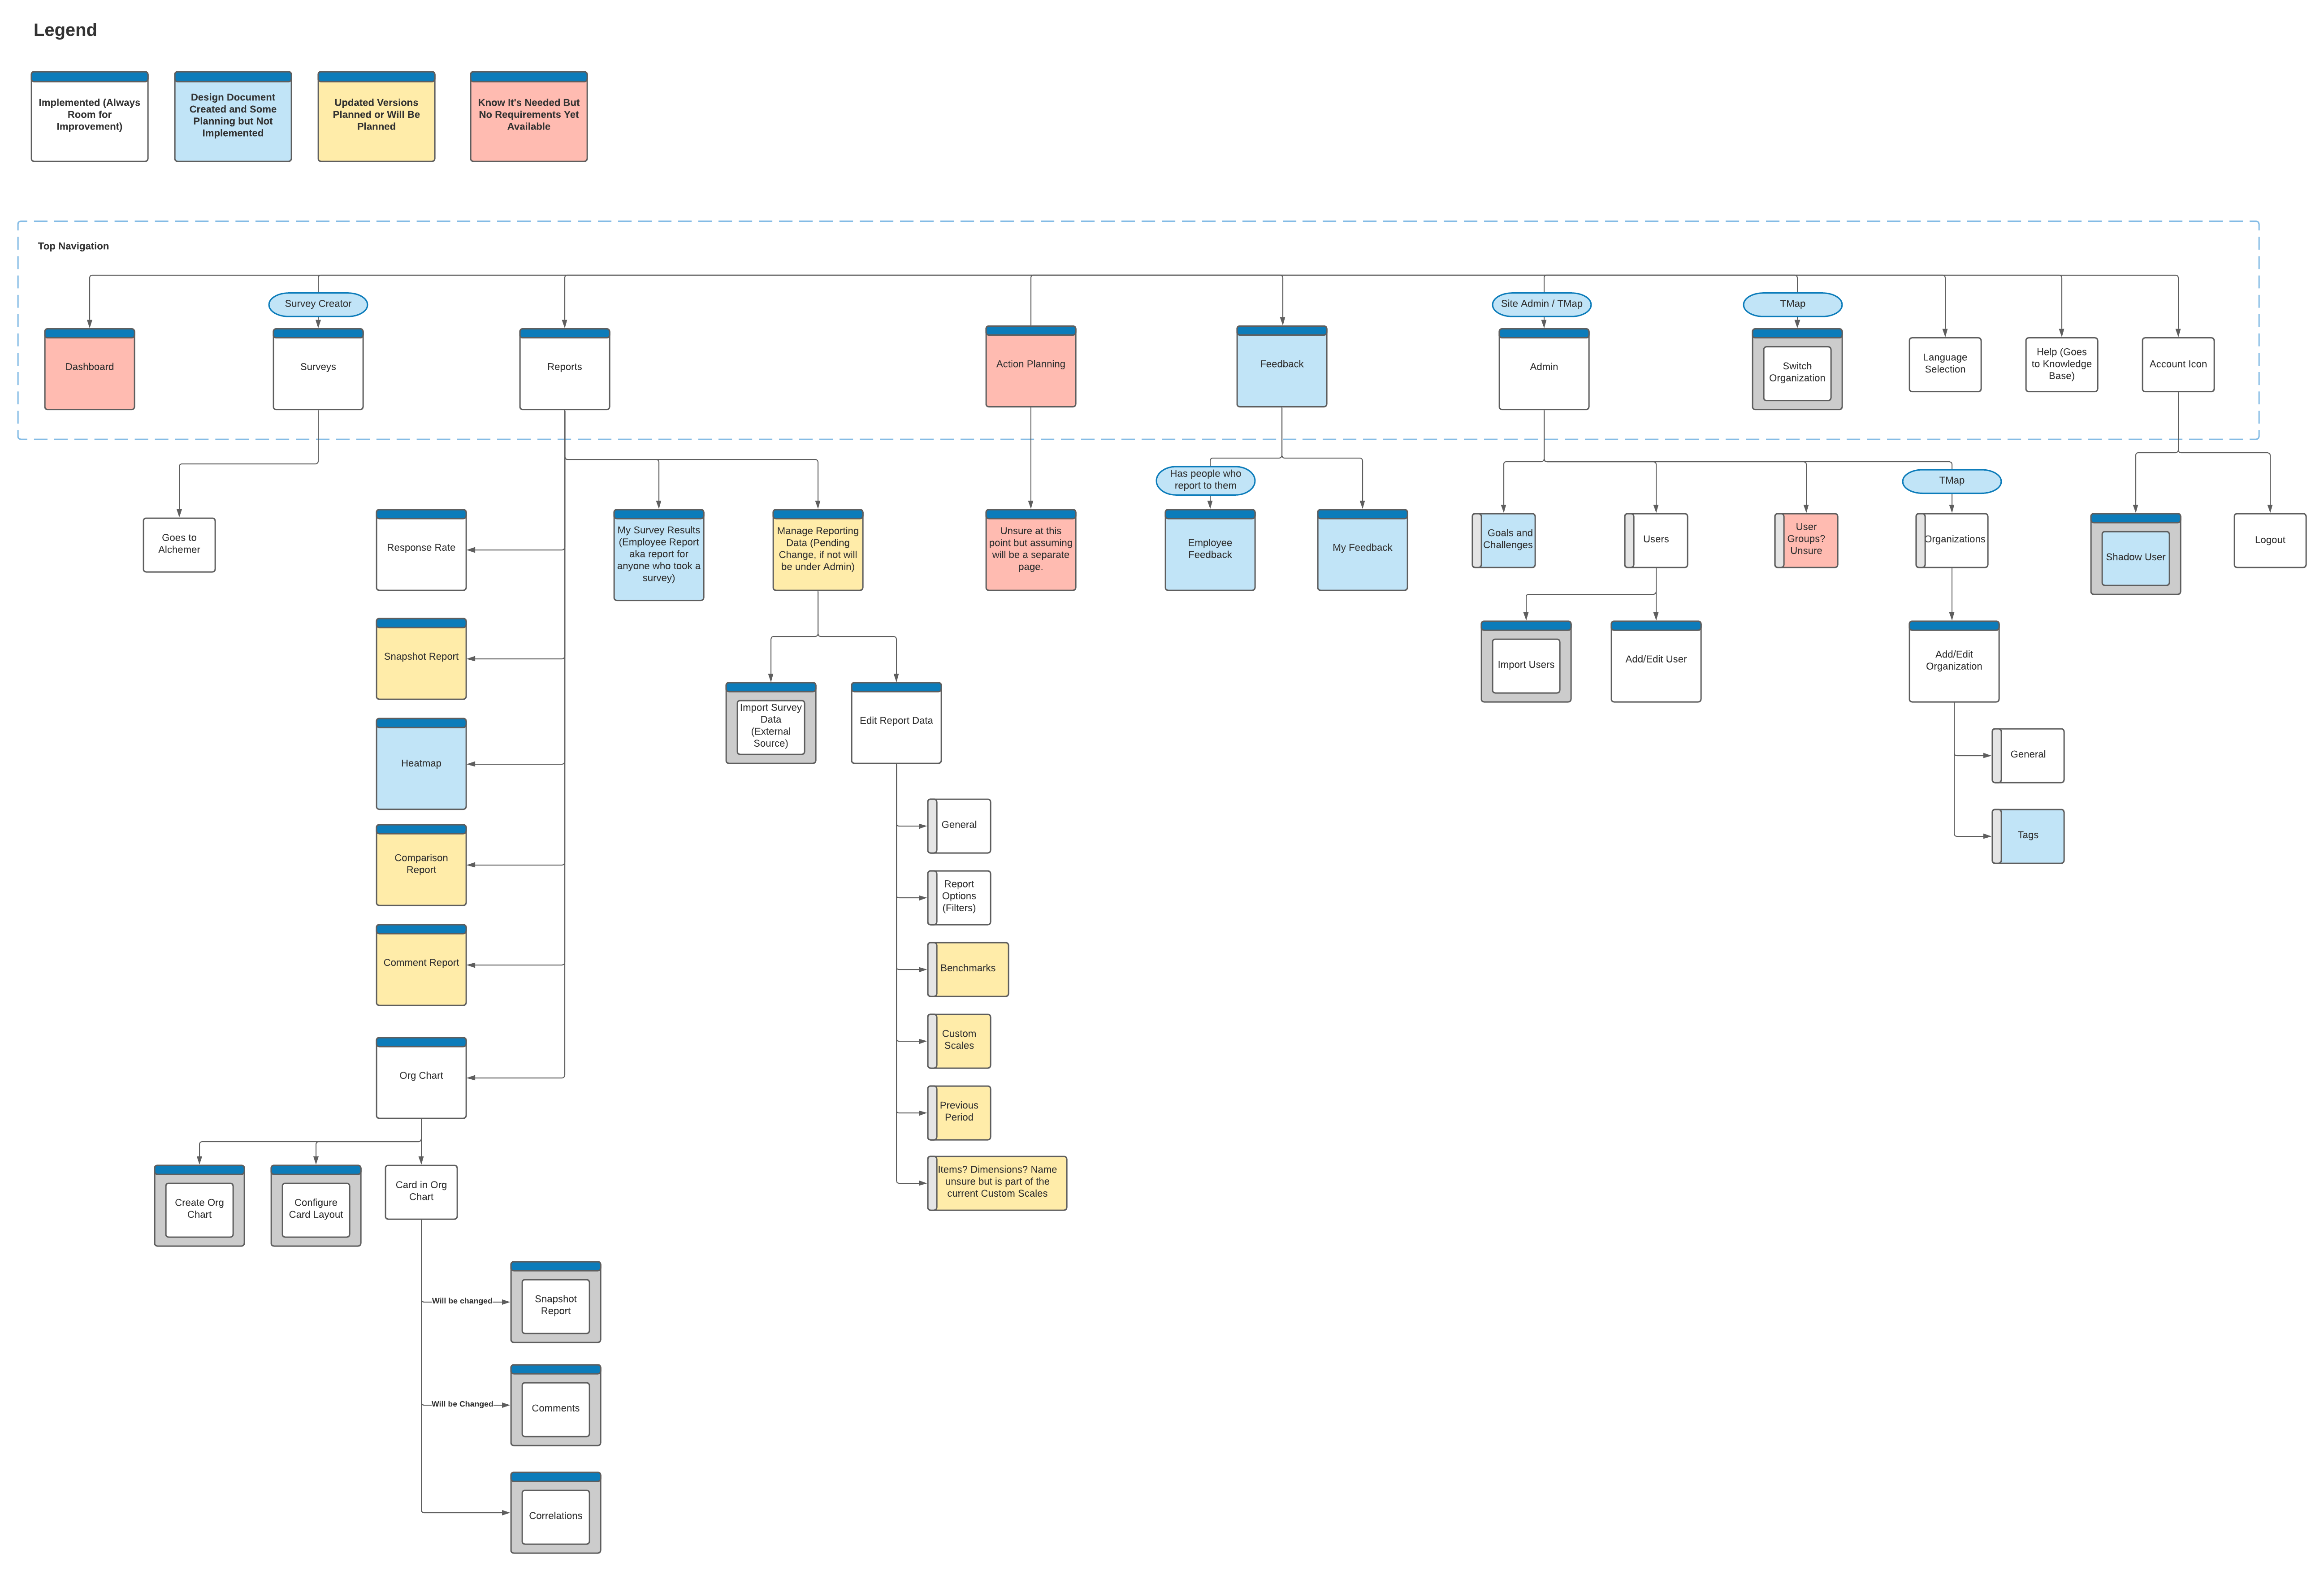
After doing some user testing we realized that placing the report settings within the Admin page made them hard to find. Also some users liked the idea of making a few changes and being able to test out the report. For that reason we placed the report settings within the reporting page.
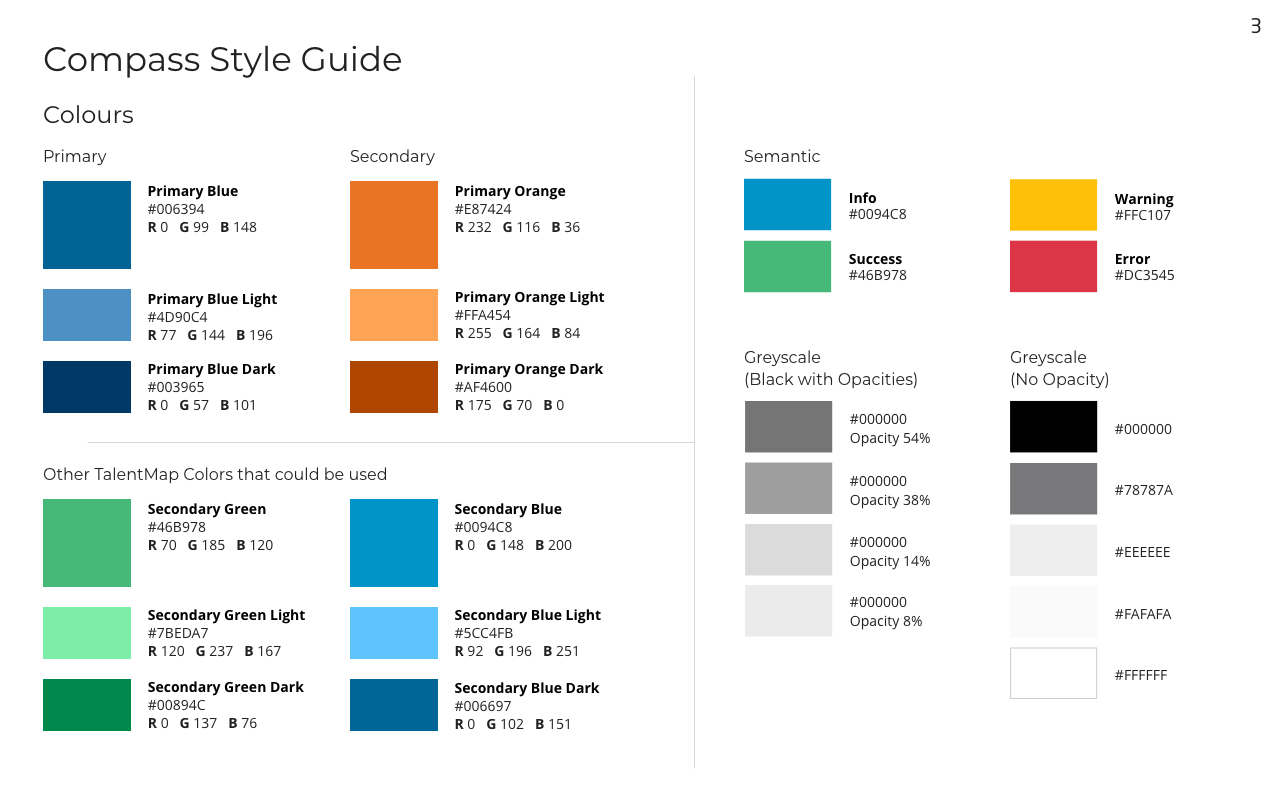
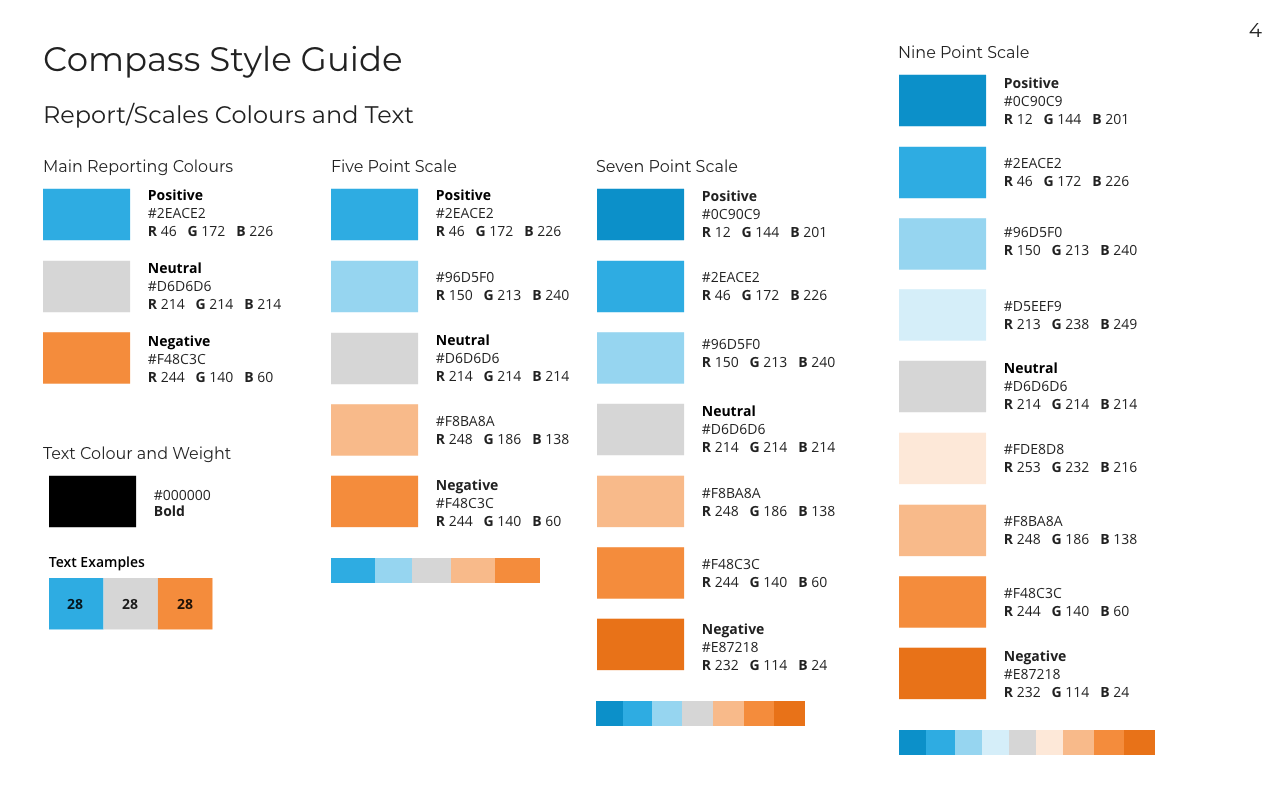
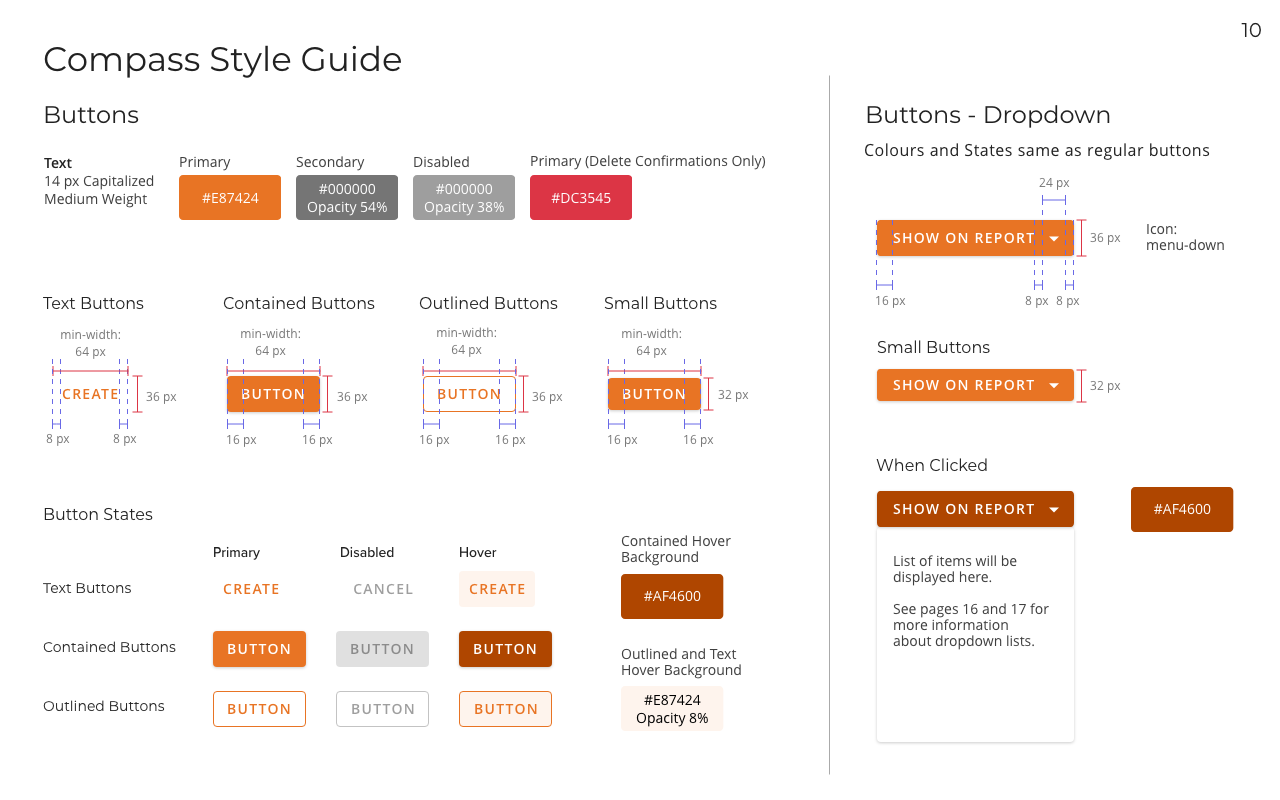
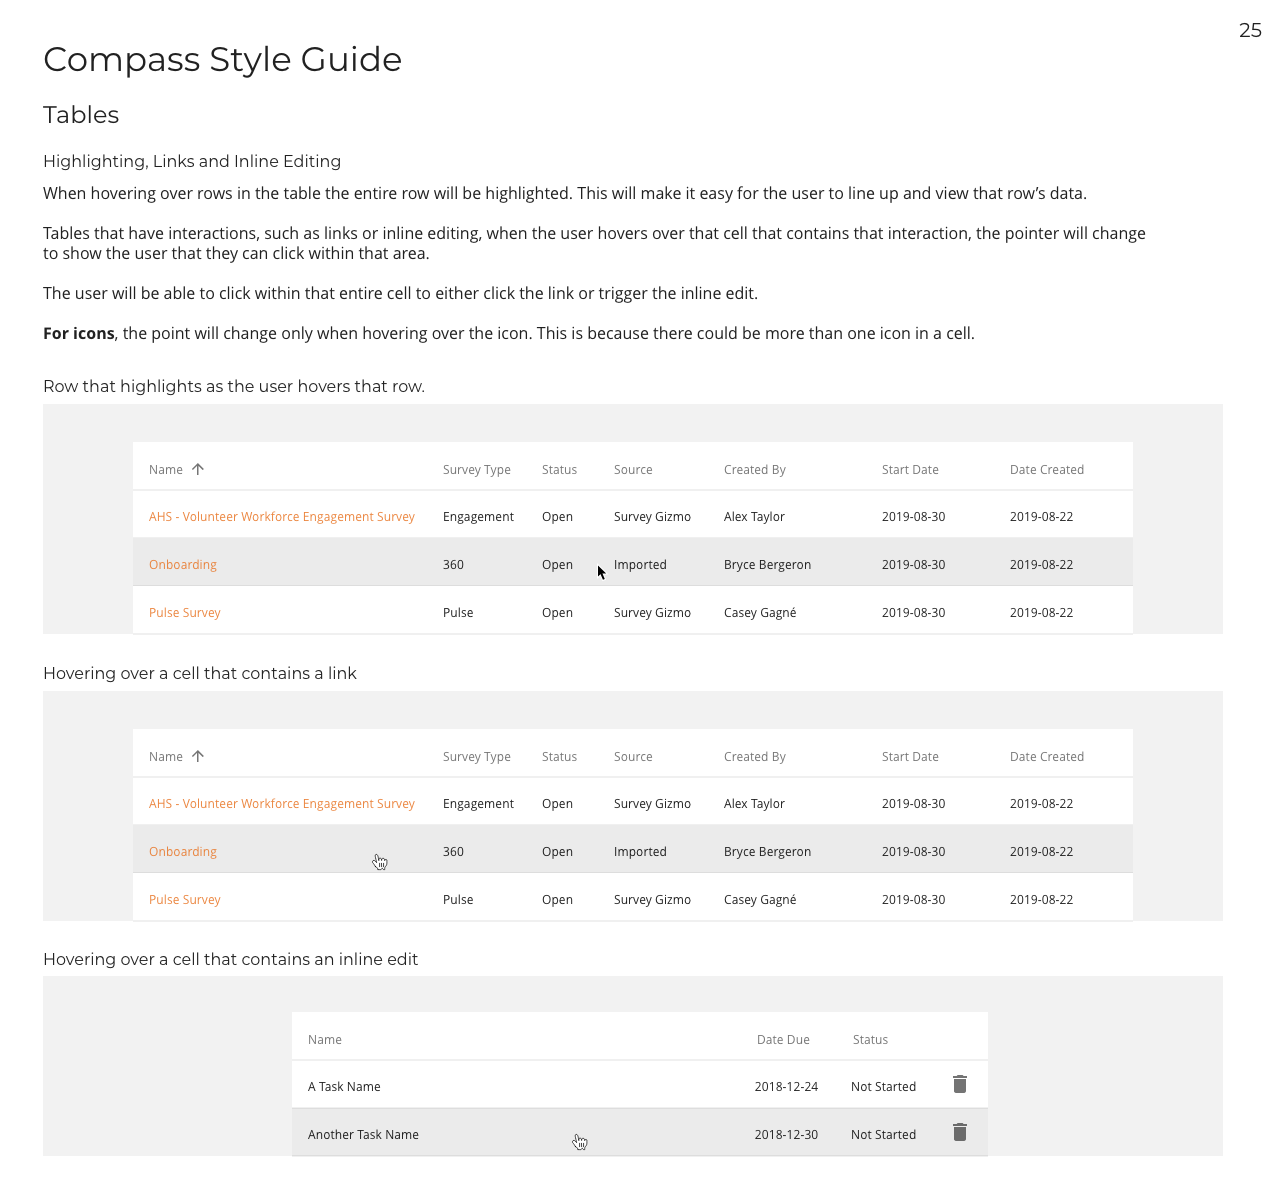
A style guide was created that include colours, fonts, icons, and various components and how they should be used. All colours for reports were tested to ensure that met accessibility standards.
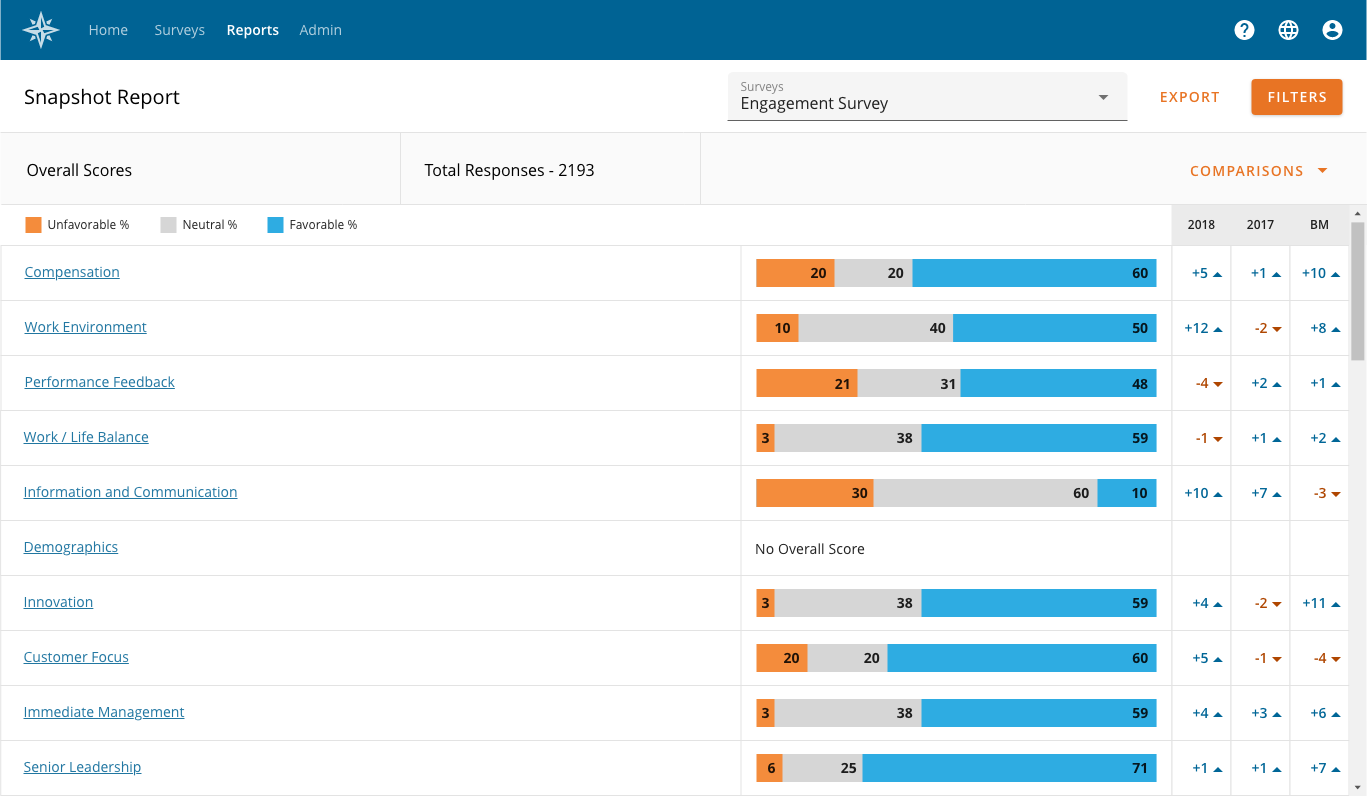
This is a report to show the overall results of a survey.
On the right are comparison to different data such as benchmarks and previous year.
The user has the option to filter the results and to export to a PowerPoint document.
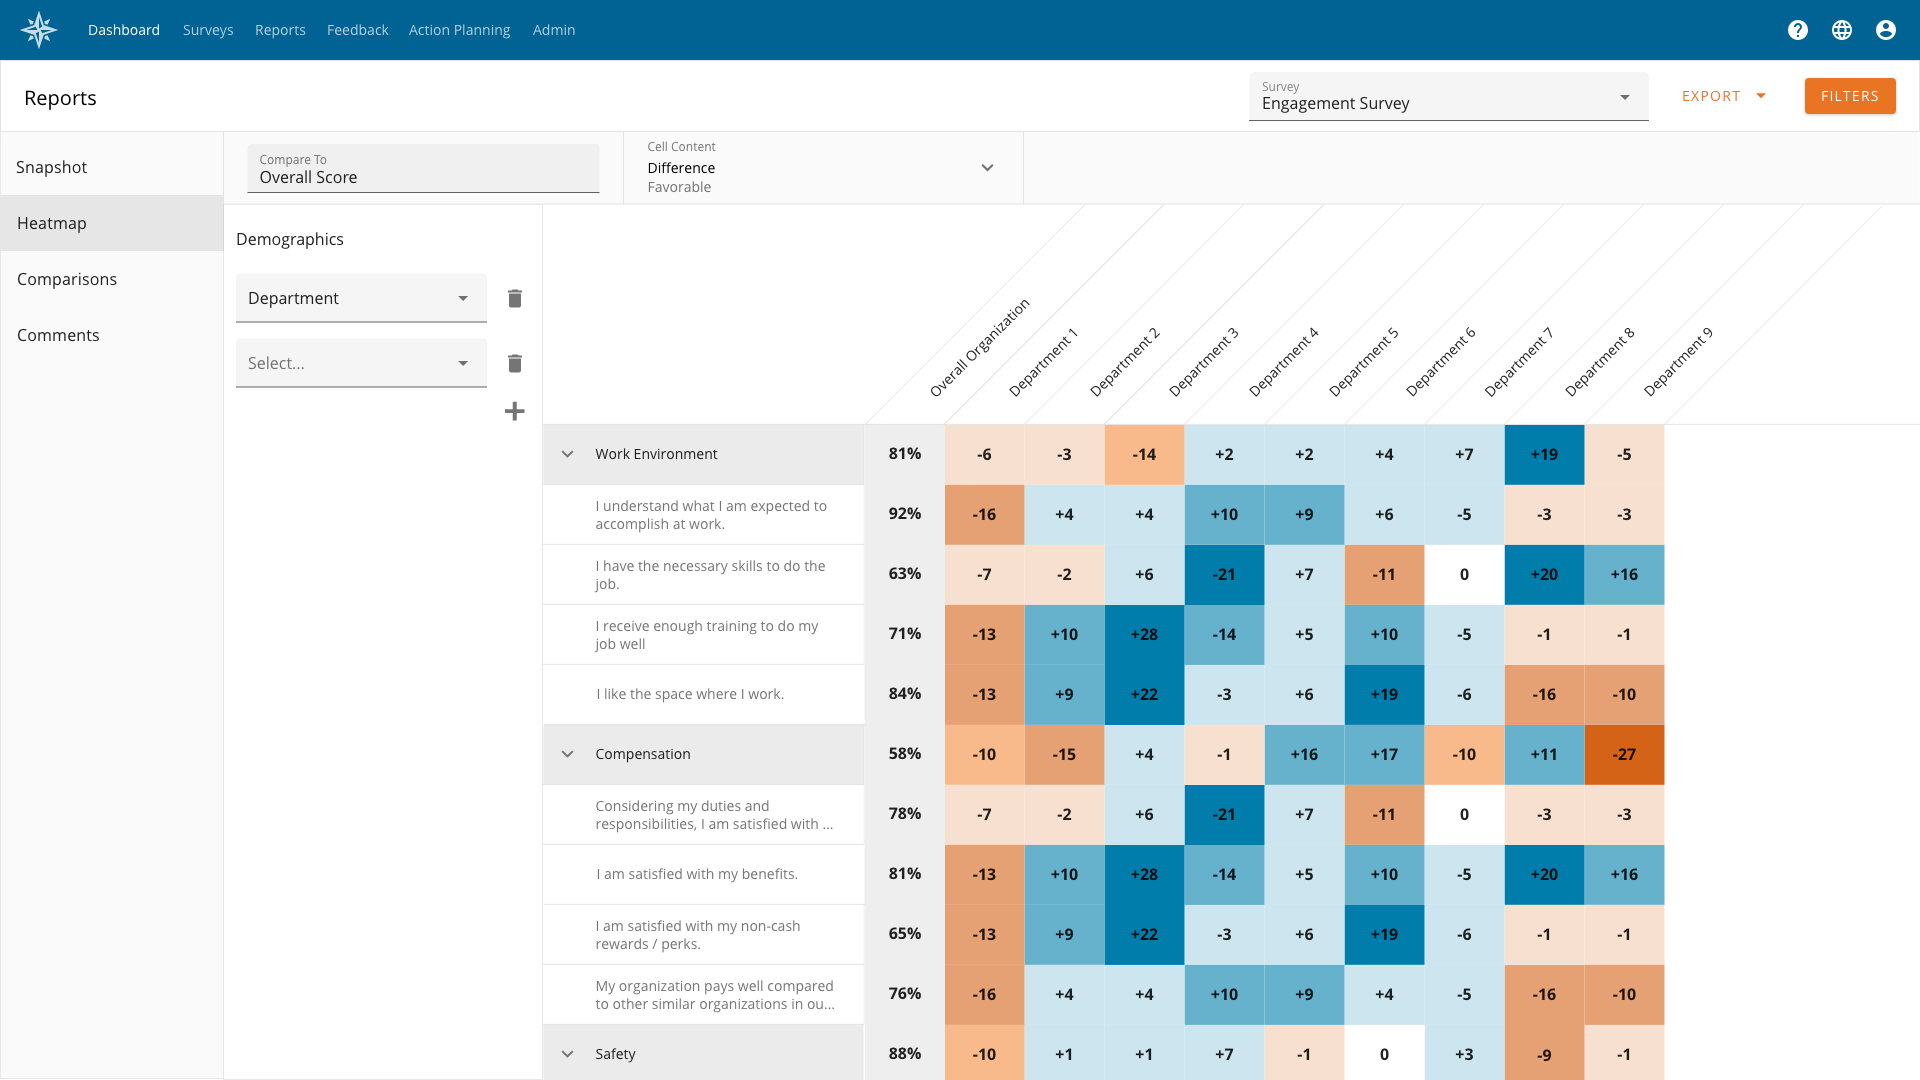
The heatmap page had a few different challenges.
The first being how to layout the page to ensure all requirements for the report were met which included:
- The ability to see the comparison from both the overall section of a survey as well as each item within.
- Allowing the user to create a nested list of demographics within the heatmap for comparison
- The ability to switch what data they are comparing to (Overall Score, Benchmark, Previous Year or a selected Demographic)
- The ability, when comparing to the overall score, to switch from comparing to the favourable score or either the neutral or the unfavourable score
Another issue came up with implementation. I worked with the dev team to look for libraries to create the heatmap. This included taking some sample code from the library and seeing if it could do what was needed. In the end they went to creating the heatmap from scratch.
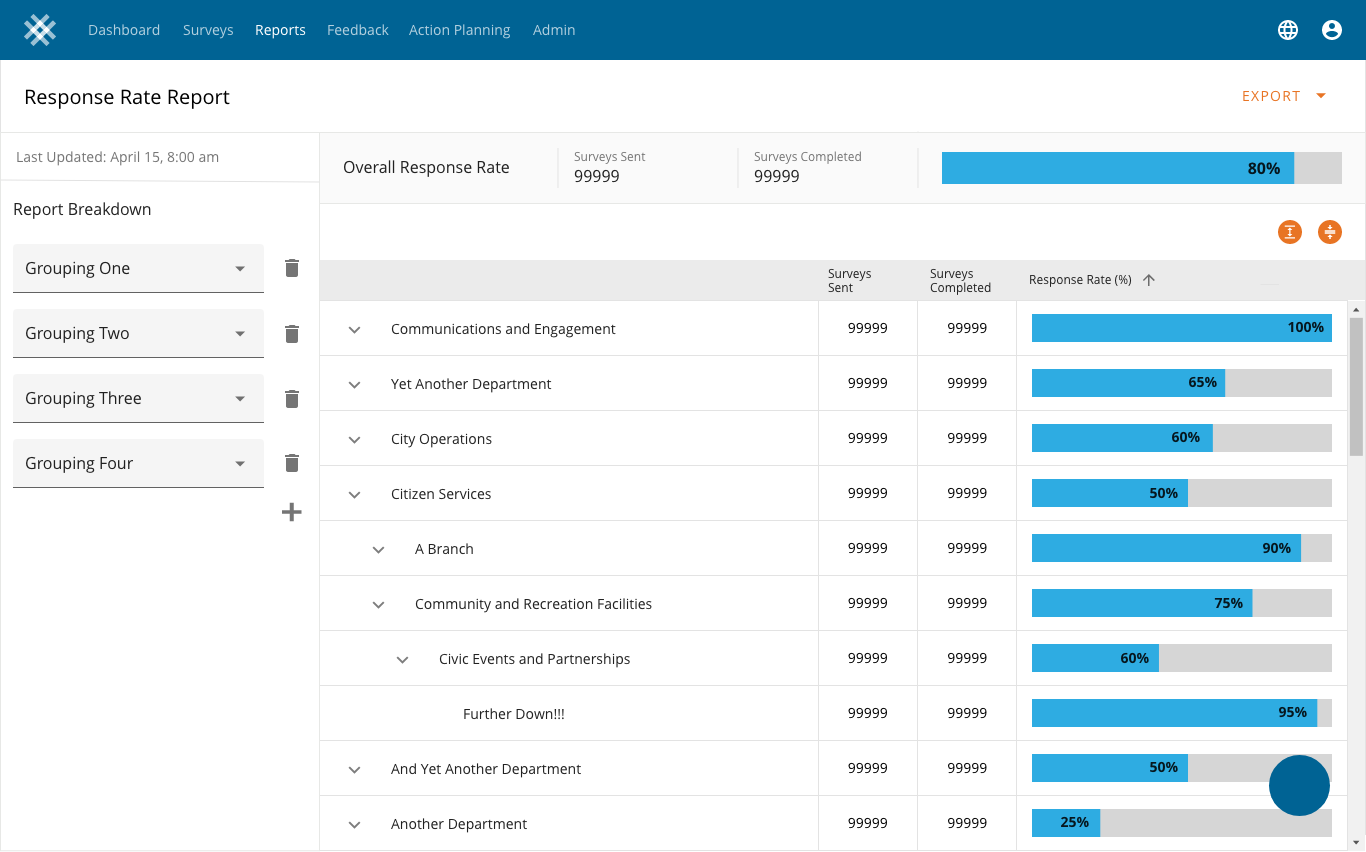
A report to show a percentage of how many surveys were completed out of how many were sent.
The user has the ability to break down the data into a nested list to see how different areas of their organization are doing.